syntelogfinder
Nextflow pipeline to group genes on polyploid phased assemblies that are orthologous and syntelogous based on GENESPACE results.
Requirements
nextflow
conda
The following packages are not in bioconda/pip so need to be installed manually if running with --profile conda (for singularity this is not necessary):
McxScan (follow instructions here and provide path to installation to
--mcscanx_path)GENESPACE (instructions) (inside the conda environment genespace-env (syntelogfinder/modules/local/genespace/genespace_run/environment.yml))
Minimal input
parameter file (params.json)
genome fasta of phased reference (chromosome names like this:
>chr[_]01_1,>chr[_]01_2Where the _suffix is the haplotype)gff/gtf with CDS corresponding to the reference (same chromosome names!)
The gff file should look like this https://agat.readthedocs.io/en/latest/gff_to_gtf.html#the-gff-file-to-convert with the following features:
gene
mRNA
exon
CDS
Or a gtf file with the following features:
gene
mRNA/transcript
exon
CDS
Mandatory Attributes
gene_id - must be present on ALL lines
transcript_id - required for transcript, exon, CDS features
Parent - links child features to parent
The params.json should look like this:
{
    "reference_fasta": "genome.fa",
    "reference_gff": "annotation.gff",
    "ploidy": 3,
    "outdir": "output_path"
}
Usage
Run like this (after cloning the repository):
nextflow run main.nf -params-file params/params.json \
                     -profile singularity \
                     -resume
or with conda:
nextflow run main.nf -params-file params/params.json \
                     -profile conda \
                     --mcscanx_path [path to MCScanX installation] \
                     -resume
Test data
A test dataset is available for testing and demonstration purposes. This dataset contains a phased genome assembly and annotation for chromosome 1 across all haplotypes of the tetraploid potato cultivar Atlantic.
The params.json should look like this:
{
    "reference_fasta": "ATL_v3.asm.chr01_all_haplotypes.fa",
    "reference_gff": "ATL_unitato_liftoff.chr01_all_haplotypes.gtf",
    "ploidy": 4,
    "outdir": "output_path"
}
Running Syntelogfinder on test data
After downloading the fasta and gtf file and preperation of the parameter file the pipeline can be run like this:
git clone https://github.com/NIB-SI/syntelogfinder.git --branch v1.0.0
cd syntelogfinder
conda create -n nextflow -c bioconda nextflow
conda activate nextflow
nextflow run main.nf \
  -params-file params/params_test.json \
  -profile singularity \
  --run_blast \
  -resume
Expected runtime: 10 minutes (if all singularity images are already pulled)
Tutorial
Output
Sample Output
The pipeline generates a tab-separated file with the following columns:
Column |
Description |
|---|---|
|
Gene identifier |
|
Transcript identifier |
|
Synteny group identifier |
|
Summary of syntenic gene distribution across haplotypes |
|
Comma-separated list of all syntenic genes |
|
Haplotype assignment |
|
CDS length classification (if applicable) |
|
Haplotype with the longest CDS annotation (if applicable) |
Example Output
gene_id     transcript_id   Synt_id synteny_category        syntenic_genes  haplotype       CDS_length_category     CDS_haplotype_with_longest_annotation
TraesAK58CH7A01G122800      TraesAK58CH7A01G122800.1        Synt_id_0       1hapA_3hapB_1hapD_no_s  TraesAK58CH7A01G122800.1,TraesAK58CH1B01G017800.1,TraesAK58CH4B01G024800.1,TraesAK58CH2B01G118200.1,TraesAK58CH2D01G119400.1    hapA
TraesAK58CH1A01G005100      TraesAK58CH1A01G005100.1        Synt_id_1       2hapA_1hapB_2hapD_no_s  TraesAK58CH1A01G005100.1,TraesAK58CH3A01G490400.1,TraesAK58CH1B01G017500.1,TraesAK58CH1D01G000500.1,TraesAK58CH7D01G525700.1    hapA
TraesAK58CH3A01G490400      TraesAK58CH3A01G490400.1        Synt_id_1       2hapA_1hapB_2hapD_no_s  TraesAK58CH1A01G005100.1,TraesAK58CH3A01G490400.1,TraesAK58CH1B01G017500.1,TraesAK58CH1D01G000500.1,TraesAK58CH7D01G525700.1    hapA
TraesAK58CH3A01G236000      TraesAK58CH3A01G236000.1        Synt_id_2       1hapA_1hapB_2hapD_no_s  TraesAK58CH3A01G236000.1,TraesAK58CH1B01G017200.1,TraesAK58CH1D01G000900.1,TraesAK58CH5D01G521100.1     hapA
TraesAK58CH1A01G006000      TraesAK58CH1A01G006000.1        Synt_id_3       3hapA_0hapB_1hapD_no_s  TraesAK58CH1A01G006000.1,TraesAK58CH3A01G436000.1,TraesAK58CH5A01G002300.1,<NA>,TraesAK58CH1D01G365400.1        hapA
TraesAK58CH3A01G436000      TraesAK58CH3A01G436000.1        Synt_id_3       3hapA_0hapB_1hapD_no_s  TraesAK58CH1A01G006000.1,TraesAK58CH3A01G436000.1,TraesAK58CH5A01G002300.1,<NA>,TraesAK58CH1D01G365400.1        hapA
Key Features
Each gene is assigned to a synteny group (
Synt_id)The
synteny_categoryshows the distribution pattern (e.g.,2hapA_1hapB_2hapD_no_smeans 2 genes in hapA, 1 in hapB, 2 in hapD, with no specific pattern)Missing syntenic genes are indicated with
<NA>All syntenic gene members are listed in the
syntenic_genescolumn
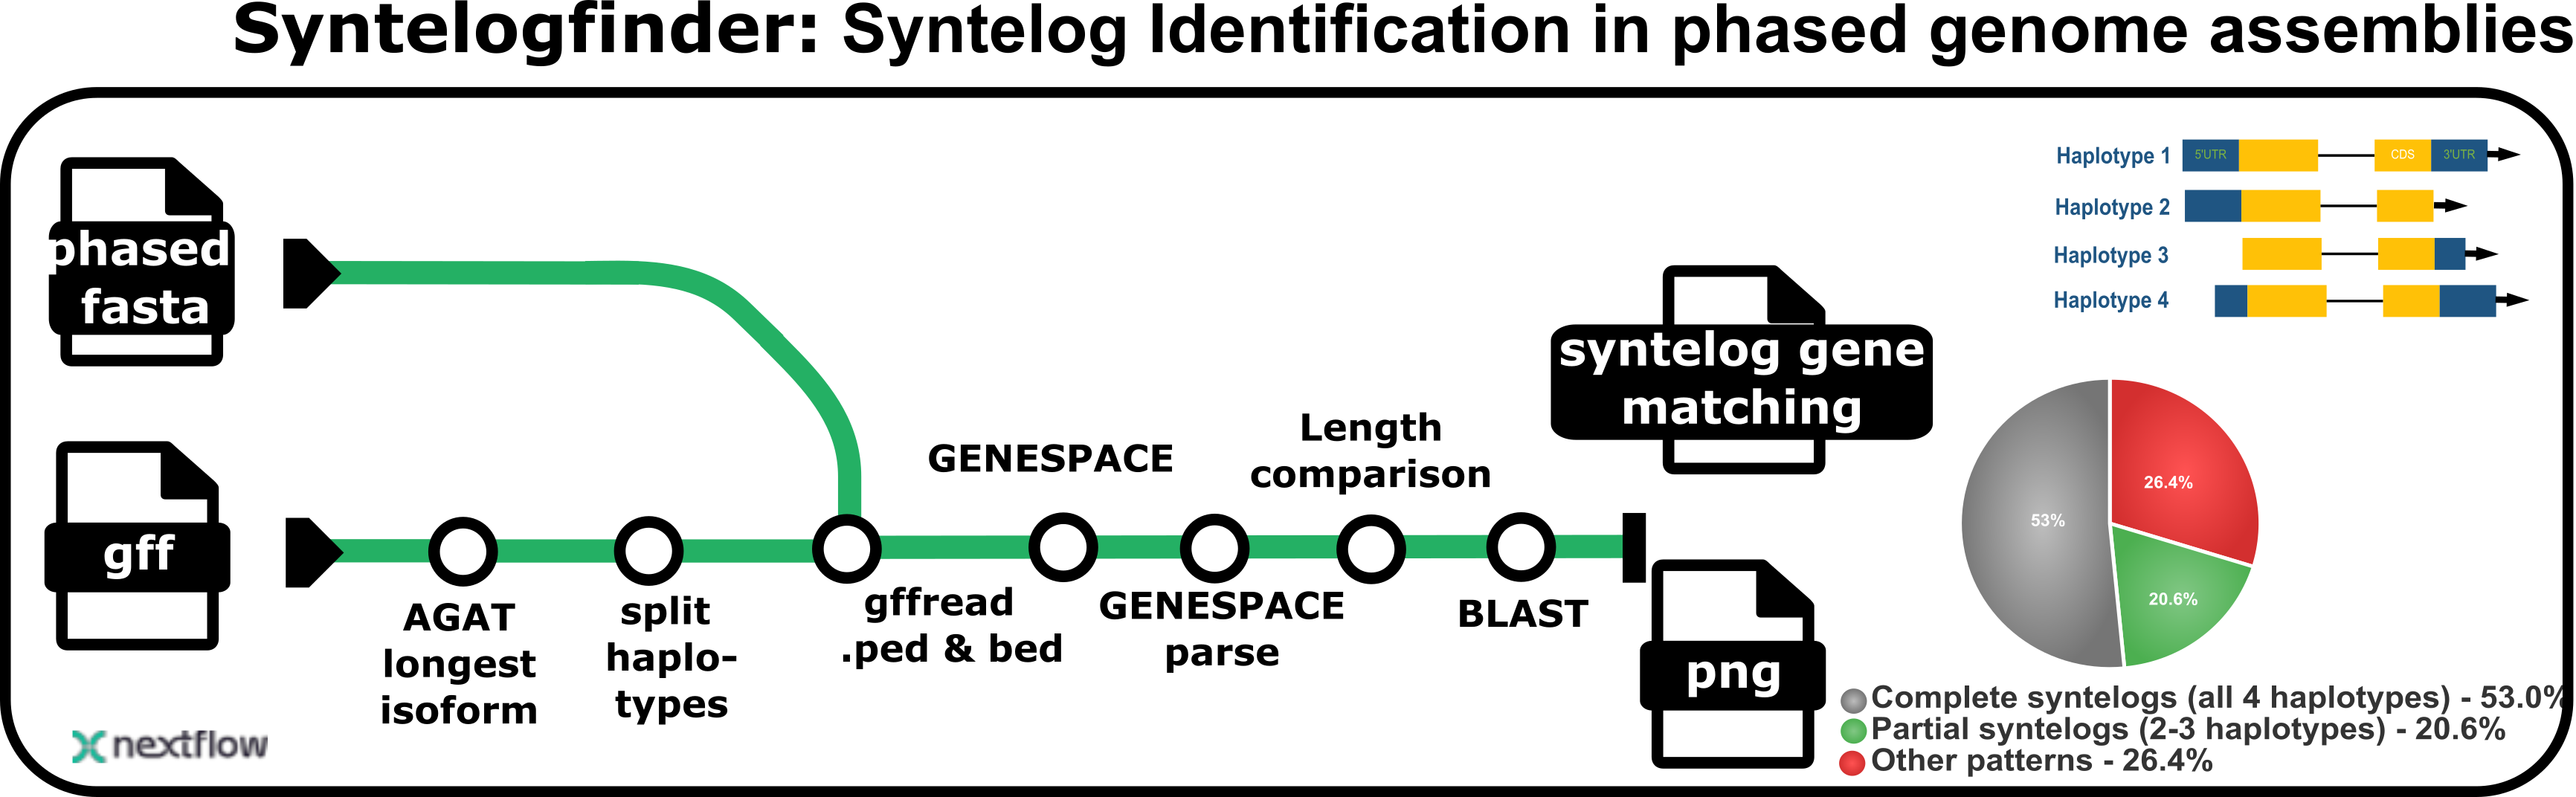
Plots
1. Pie Chart (Genespace_pie_chart.svg)
Shows the distribution of syntelog categories.

2. Combined Bar Plots (Genespace_combined_barplots.svg)
Displays detailed statistics for each syntelog category. Exon lengths should be very similar between gene pairs since we used lifted annotations.

Troubleshooting
If GENESPACE process is interrupted, running with
-resumeflag will fail. To cache the other processes, delete the genespace work dir before resuming